Facebook
 X
X
 Pinterest
 Copy Link
Abilene Housing Market Update – June 2026
If you’ve been following our market updates over the past year, you’ve probably noticed a recurring theme: demand continues to outpace supply.
That was still true in June.
Home prices continued to rise, inventory remains well below historical norms, and buyers are still competing for quality homes in many price ranges. At the same time, there are a few signs that conditions may be moving in a healthier direction than we’ve seen over the past several months.
Prices Continue to Move Higher
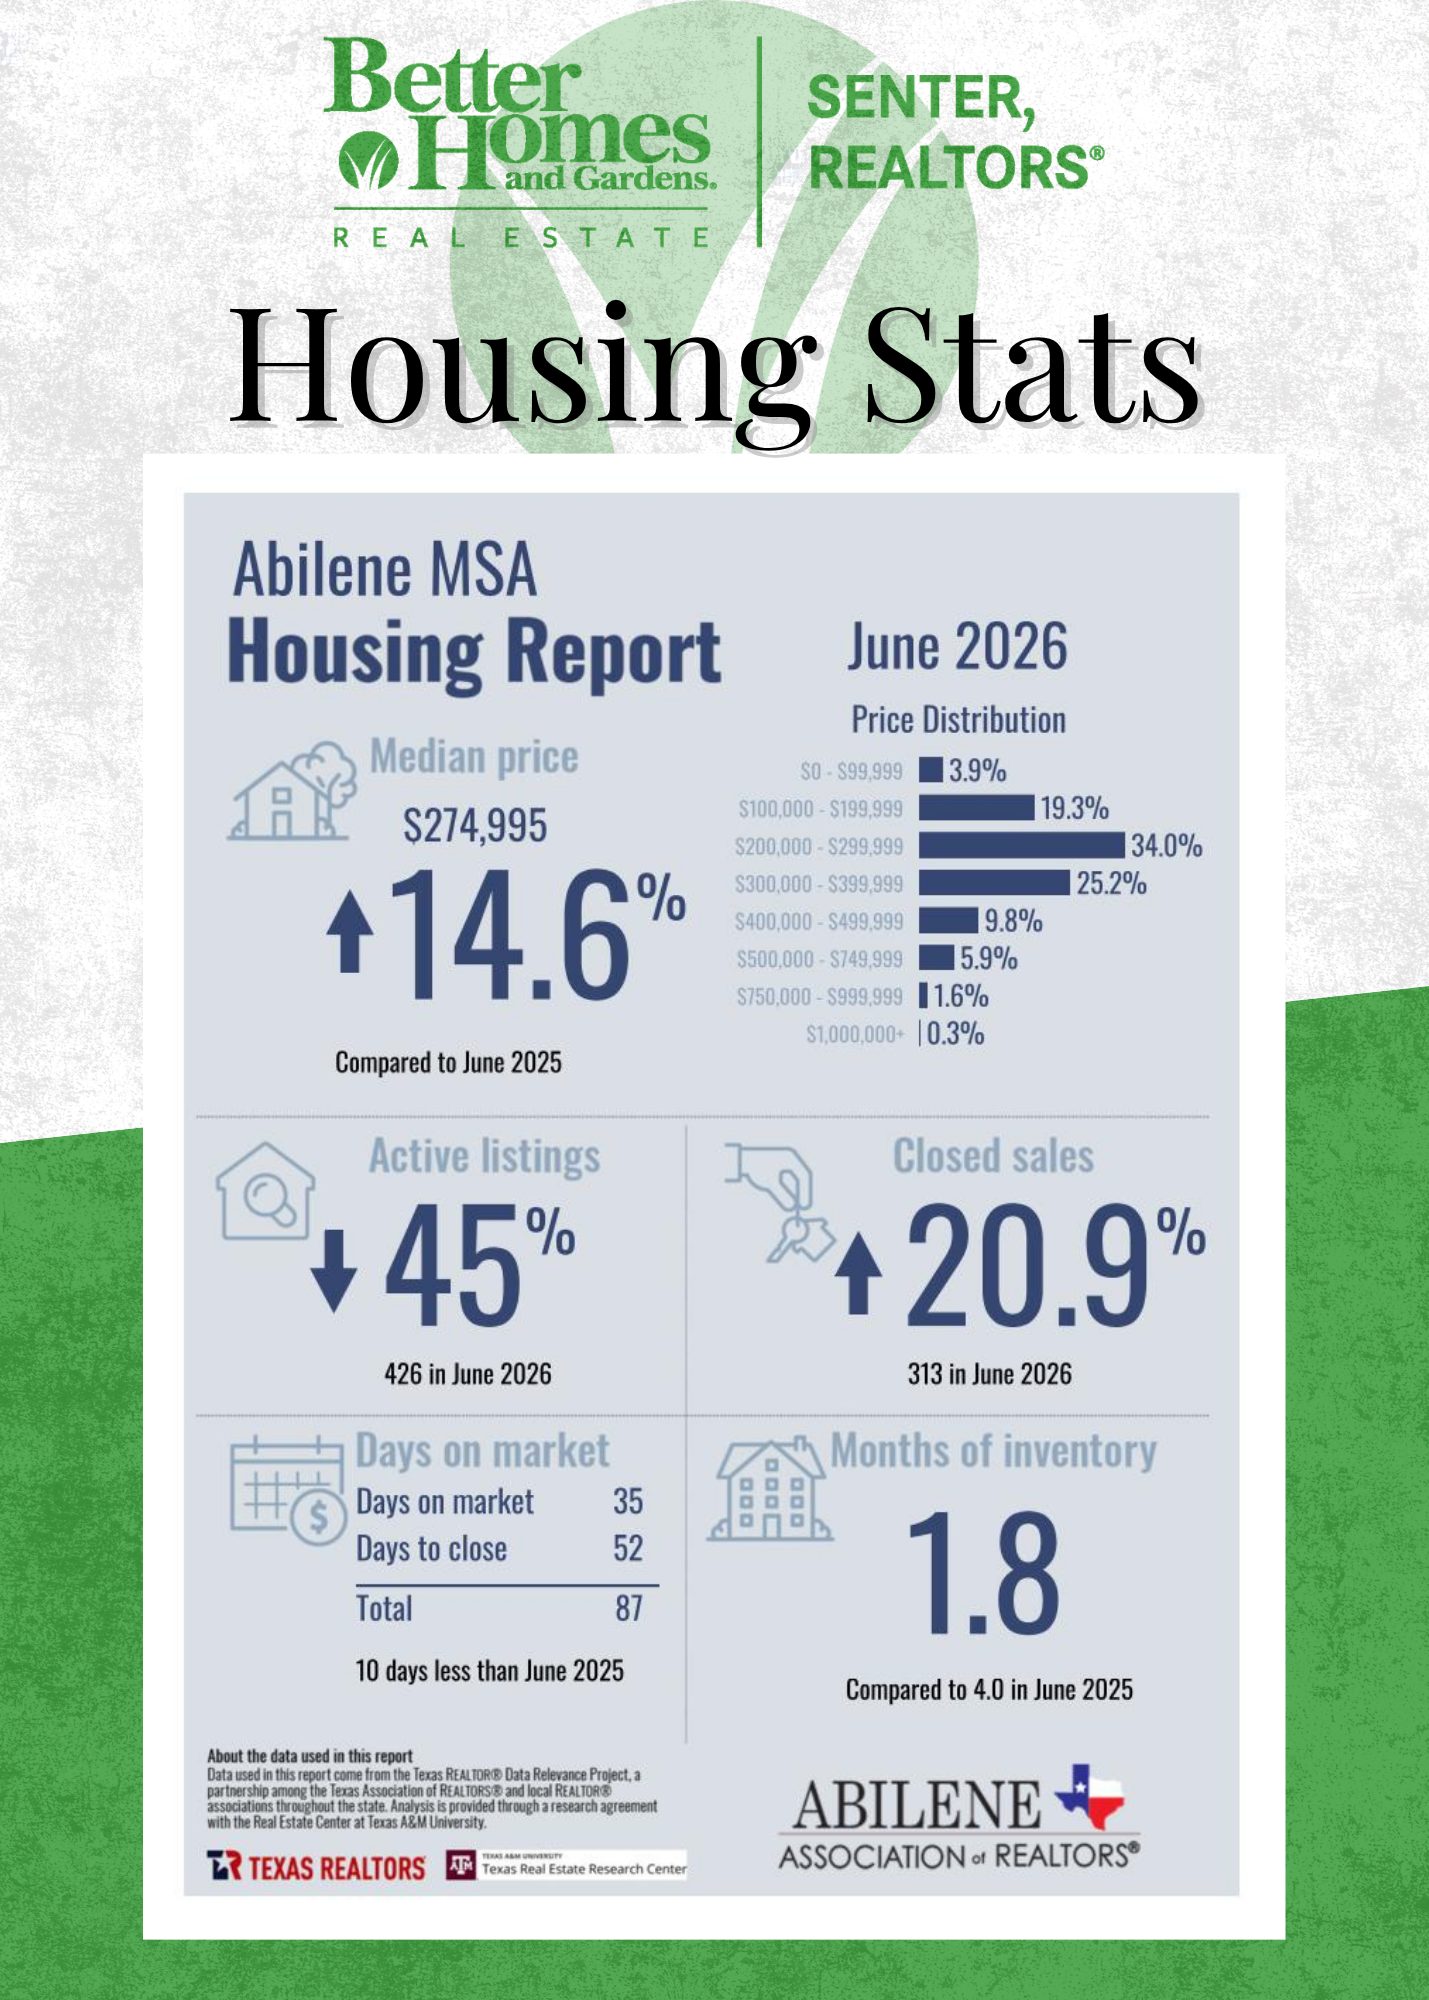
The median home price in the Abilene MSA reached $274,995 in June, up 14.6% from June 2025.
That’s a significant year-over-year increase, but it shouldn’t come as a surprise given the inventory challenges we’ve been discussing for much of the past year.
When there aren’t enough homes available to meet buyer demand, prices tend to move higher. That’s exactly what we’ve been seeing.
The encouraging news is that inventory showed some improvement this month.
Inventory Climbs Back Above 400 Homes
The market finished June with 426 active listings.
While that’s still 45% lower than June of last year, it’s also the first time in several months that inventory has climbed back above the 400-home mark.
By itself, that doesn’t solve our inventory shortage. We’re still operating with far fewer homes available than we’d like to see. But it’s a positive step.
It’s also worth noting that June 2025 was the point where inventory began declining sharply. As we moved through the second half of last year, the gap between available inventory and buyer demand continued to widen.
Today we’re still behind last year’s levels, but the gap has started to narrow compared to the healthiest inventory levels we saw during 2025.
It’s too early to call it a trend, but it’s certainly something worth watching.
Buyers Are Still Active
Closed sales increased 20.9% compared to June 2025, with 313 homes closing during the month.
That tells us buyers haven’t disappeared despite higher prices and affordability concerns.
In fact, we’re continuing to see strong activity whenever a home is priced correctly and positioned well in the market.
For buyers, inventory remains the biggest challenge. Many are finding themselves qualified to purchase but struggling to find enough options that fit their needs.
A Closer Look at the $300,000-$400,000 Market
One of the more interesting statistics this month comes from the price distribution data.
Homes priced between $300,000 and $399,999 represented 25.2% of all sales in June, marking one of the largest market shares this price range has captured in recent years.
At first glance, that might suggest buyers are becoming increasingly active throughout the entire $300,000-$400,000 segment. However, when we take a closer look at the local MLS data, a different story emerges.
Approximately 65% of those sales occurred between $300,000 and $350,000 rather than being spread evenly across the entire price range.
That distinction matters.
What we’re really seeing is continued upward pressure on pricing. Many homes that would have fallen into the upper $200,000 range several years ago are now selling in the low-to-mid $300,000s.
So while the $300,000-$400,000 segment is capturing a larger share of the market, much of that activity remains concentrated in the lower half of the range.
Homes Are Still Moving Quickly
The average days on market fell to 35 days, down from 45 days a year ago.
That’s another reminder that despite higher prices, demand remains healthy for well-priced homes.
We’re still seeing many of the same patterns we’ve discussed throughout the year:
- Homes priced appropriately continue to attract strong interest.
- Buyers remain sensitive to condition and presentation.
- Overpriced listings generally sit longer and require price adjustments.
- Inventory is improving, but buyers still don’t have an abundance of choices.
What We’re Watching
The biggest number I’ll be watching over the next few months isn’t price—it’s inventory.
Prices tend to be a lagging indicator. Inventory often gives us a much earlier look at where the market may be headed.
Seeing active listings climb back above 400 is encouraging, especially after several months of extremely limited supply. If inventory continues to improve, buyers could gain more options and some of the upward pressure on prices may begin to ease.
For now, however, the story remains largely the same.
Demand is strong. Inventory is limited. Prices continue to rise.
The difference this month is that we’re finally seeing a few early signs that the inventory side of the equation may be starting to improve.
June 2026 Abilene MSA Housing Statistics
- Median Price: $274,995 (+14.6%)
- Active Listings: 426 (-45.0%)
- Closed Sales: 313 (+20.9%)
- Days on Market: 35
- Months of Inventory: 1.8
Data provided by the Abilene Association of REALTORS® and the Texas REALTORS® Data Relevance Project.